
Why Photovoltaic Bracket Roll Forming Lines Lose Output
Table of Contents
A photovoltaic bracket roll forming line may be advertised with a high forming speed but produce far fewer qualified brackets during an actual shift. This difference occurs because the roll former is only one part of the complete production system.
Coil loading, strip leveling, servo feeding, punching, forming, cutting, inspection and stacking must operate as a coordinated process. If one repeated stage is slower than the others, it limits the output of the complete line.
Common causes of lost production include:
- Dense punching patterns
- Slow stop-to-cut cycles
- Frequent coil changes
- Long profile changeovers
- Unstable strip feeding
- Excessive setup scrap
- Tool wear and repeated adjustment
- Quality defects
- Manual collection and stacking
- Unrecorded minor stops
- Poor maintenance access
- Unrealistic capacity calculations
The correct production measure is not the maximum speed of the forming rollers. It is the number of qualified finished brackets produced per hour or shift under defined material, profile, hole-pattern and operating conditions.
What Determines Photovoltaic Bracket Roll Forming Output?
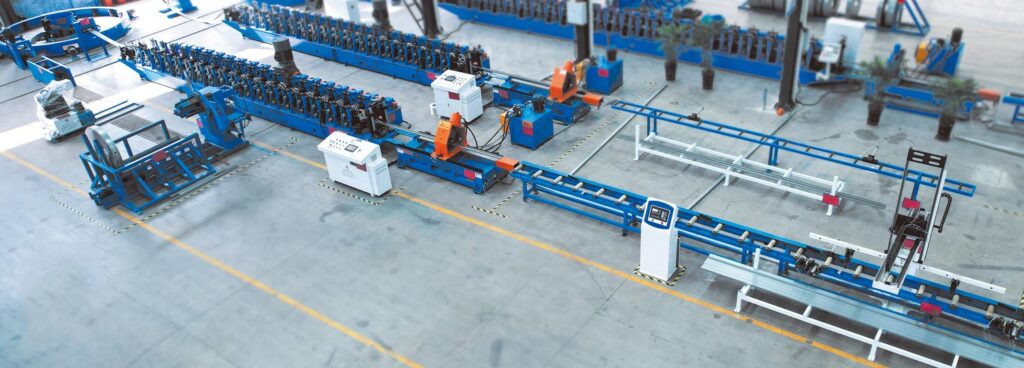
Photovoltaic bracket roll forming converts metal coil into structural profiles used in solar mounting systems. Common products include C-channels, U-channels, slotted struts, Z-shaped purlins, ground-support posts and other customized sections.
A typical production line contains:
- Coil-loading system
- Decoiler
- Leveling unit
- Servo feeder
- Punching system
- Roll forming machine
- Straightening device
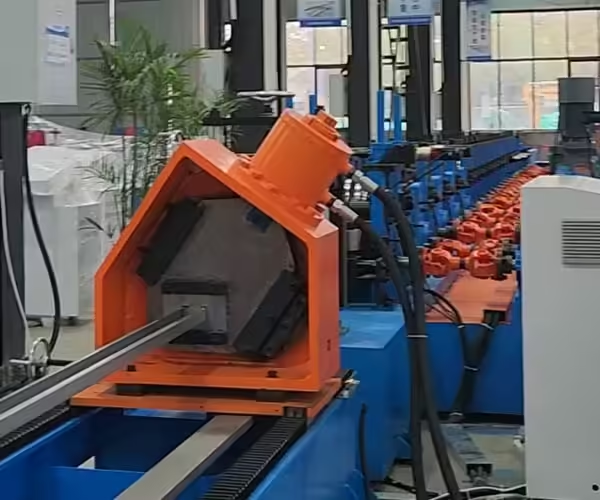
- Cutting system
- Run-out table
- Stacking or packaging equipment
Jinbolida’s Solar Photovoltaic Bracket Forming Machine range includes equipment for producing different photovoltaic support profiles from coil-based materials.
The output of the line depends on the combined cycle time of every required operation.
Maximum Forming Speed
Maximum forming speed describes how quickly material can move through the roller stations under specified conditions. It may not include punching, cutting, coil changes, inspection or stacking.
This figure is useful for machine design, but it should not be used alone to estimate daily output.
Qualified Line Speed
Qualified line speed is the average rate at which the complete system produces profiles that meet the agreed dimensional, hole-position and surface requirements.
A line may run mechanically at a high speed but create:
- Inaccurate holes
- Unstable cut lengths
- Profile twist
- Surface scratches
- Excessive burrs
- Stacking damage
Reducing the speed until the profiles become acceptable means the original maximum speed did not represent qualified production.
Finished Pieces per Shift
For production planning, finished pieces per shift is often more useful than meters per minute.
The calculation should use:
- Actual product length
- Number of holes and slots
- Punching cycle
- Cutting method
- Coil-change time
- Changeover frequency
- Inspection time
- Planned maintenance
- Typical downtime
- Rejection rate
The Slowest Repeated Process Controls the Line
A photovoltaic bracket roll forming line operates as one connected system. The slowest operation that must be repeated for every product or batch becomes the production bottleneck.
| Production stage | Possible output restriction |
|---|---|
| Coil loading | Long preparation and unsafe positioning |
| Decoiling | Unstable coil release or frequent stops |
| Leveling | Slow adjustment or strip distortion |
| Servo feeding | Acceleration limits or material slippage |
| Punching | Dense patterns and long press cycles |
| Roll forming | Complex profiles or high-strength material |
| Cutting | Stop-to-cut interruption |
| Inspection | Excessive manual checking |
| Receiving | Long products cannot be removed quickly |
| Stacking | Finished profiles accumulate at the line exit |
| Changeover | Tooling replacement and recalibration |
| Maintenance | Poor access increases repair time |
Increasing the speed of a stage that is already faster than the bottleneck will not significantly improve total output.
For example, increasing the roll former from 25 to 35 meters per minute provides little value if the punching system can only support the equivalent of 15 meters per minute for the selected hole pattern.
1. Punching Limits the Complete Line
Photovoltaic brackets often contain repeated holes and elongated slots. Punching frequency can become the main output restriction.
Jinbolida’s Solar Photovoltaic Rack Punching Equipment includes three-, six- and nine-station systems for different bracket features.
Hole Density Changes the Cycle
Two profiles with the same length may require very different production times.
Profile A may contain four holes, while Profile B contains thirty slots, several notches and an embossed feature. The roll former sees the same length, but the punching system completes many more operations for Profile B.
Capacity should therefore be calculated for each representative hole pattern.
Stop-and-Punch Operation
Some systems stop the strip before every punch. This can provide stable positioning, but repeated deceleration and acceleration reduce average speed.
The total punching cycle includes:
- Strip deceleration
- Position confirmation
- Press movement
- Punch penetration
- Tool return
- Slug removal
- Strip acceleration
Press strokes per minute do not show the full material-positioning time.
Flying Punching
Flying punching can operate while the strip continues moving. It may improve output for suitable products, but the system requires accurate synchronization and adequate moving-tool travel.
The configuration should be tested with:
- Minimum and maximum product lengths
- Dense hole patterns
- Maximum material thickness
- Normal operating speed
- Real production material
Tool Wear Reduces Speed
As punches and dies wear, burrs and stripping force may increase. Operators may reduce line speed or stop frequently to clean slugs and adjust tooling.
A tooling-maintenance plan should record:
- Number of strokes
- Burr condition
- Tool sharpening
- Clearance
- Punch replacement
- Die replacement
- Product-specific wear
2. Cutting Interrupts Material Flow
After forming, the profile must be cut to the programmed length. The cutting method strongly influences real line speed.
Stop-to-Cut
A stop-to-cut system temporarily stops the strip or profile.
Its cycle includes:
- Line deceleration
- Position confirmation
- Tool movement
- Cutting
- Tool return
- Line acceleration
For long profiles with few cuts, the interruption may be relatively small. For short profiles, frequent cutting can substantially reduce output.
Flying Cut-Off
A flying cut-off travels with the moving profile. It can reduce interruptions, but the control system must synchronize tool speed, product position and cutting movement.
Poor synchronization may cause:
- Incorrect cut length
- Angled ends
- Profile deformation
- Tool impact
- Repeated alarms
Cutting Tool Condition
Worn or incorrectly adjusted cutting tools can create burrs, crushed ends or unacceptable length variation. The line may continue operating, but qualified output declines as more pieces require rework or rejection.
3. Coil Changes Consume More Time Than Expected
Production planning often assumes that the line runs continuously throughout the shift. In reality, every coil eventually needs replacement.
A coil change may require:
- Stopping the line
- Removing the coil remainder
- Loading a replacement coil
- Centering the coil
- Expanding the decoiler
- Preparing the leading edge
- Threading the strip
- Resetting guides
- Producing setup pieces
- Confirming the new material
If a product uses narrow strip or heavy profiles, the number and duration of coil changes can materially affect daily output.
Reduce Coil-Change Downtime
Possible methods include:
- Coil cars
- Double-head decoilers
- Pre-staged replacement coils
- Standardized loading procedures
- Coil-head preparation
- Strip joining
- Material accumulators
- Clear crane or forklift routes
These features should be justified by actual coil consumption and shift requirements.
Material Identification
Incorrect coil selection can cause more loss than the loading time itself. If the wrong grade, thickness or coating enters the line, the resulting profiles may require quarantine or rejection.
Coil identification and recipe verification should be part of the loading procedure.
4. Profile Changeovers Reduce Available Production Time
A flexible photovoltaic bracket roll forming system may produce several related profile sizes, but every changeover uses production time.
Changeover tasks may include:
- Replacing roller tooling
- Moving roller stands
- Adjusting spacers
- Changing guides
- Replacing punching dies
- Changing the cut-off tool
- Adjusting the straightener
- Loading a new recipe
- Producing trial pieces
- Completing first-article inspection
The changeover is not complete when the tools have been installed. It is complete when the first qualified product from the new setup is approved.
Measure Changeover Correctly
Record the time between:
- The last qualified product from the previous batch
- The first qualified product from the new batch
This includes setup, testing and inspection.
Separate Internal and External Preparation
Some activities can be completed while the line is still producing the previous product.
Examples include:
- Preparing the next tooling set
- Confirming drawings
- Checking the next coil
- Loading recipes
- Preparing inspection instruments
- Positioning lifting equipment
Moving these tasks outside the actual line stop can reduce lost production time.
5. Setup Scrap Reduces Material Yield
Every setup or adjustment can produce nonconforming material.
Typical causes include:
- Incorrect roller gaps
- Incomplete recipes
- Wrong punching pattern
- Strip misalignment
- Unstable leveling
- Cutter calibration
- Straightener adjustment
- Material change
- Tooling replacement
A line may show a high running speed while consuming excessive material during setup.
Measure Setup Scrap Separately
Record:
- Scrap length per startup
- Scrap length per product change
- Scrap after coil change
- Scrap after tooling maintenance
- Scrap caused by alarms
- Scrap used for first-article approval
This helps distinguish normal process waste from avoidable adjustment loss.
Standardize Proven Settings
Maintain records for each product:
- Roller positions
- Guide positions
- Leveler settings
- Punching recipe
- Cutter setting
- Straightener setting
- Approved material range
- Inspection results
Stored settings reduce repeated trial-and-error adjustment.
6. Quality Defects Hide Behind High Speed
Running faster can increase mechanical output while reducing the percentage of acceptable profiles.
Common defects include:
- Incorrect cross-section
- Hole-position error
- Cut-length variation
- Profile twist
- Bow or camber
- Excessive burrs
- Coating scratches
- Crushed cut ends
- Stacking damage
A factory should separate total pieces from qualified pieces.
Quality Rate
Quality rate compares accepted production with total production.
If a line produces 1,000 pieces but 80 require rework or rejection, the useful output is 920 pieces, not 1,000.
The definition of overall equipment effectiveness commonly considers availability, performance and quality together. For photovoltaic bracket production, this is more informative than recording only the time the machine was moving.
Defects May Appear Later
Some problems are not discovered at the line exit.
Examples include:
- Hole patterns that do not match connectors
- Gradual twist over long profiles
- Coating damage beneath stacked components
- Incorrect batch identification
- End-to-hole distance errors
Inspection should therefore include functional assembly features, not only appearance.
7. Manual Stacking Becomes a Bottleneck
Long photovoltaic profiles require controlled receiving and stacking. When operators cannot remove products quickly enough, the line must slow down or stop.
Manual handling becomes difficult when:
- Profiles are long
- Line speed is high
- Products are heavy
- Stacks require alignment
- Packaging occurs near the line
- Several products exit in rapid succession
- Floor space is limited
Signs That Stacking Controls Output
- Finished profiles accumulate on the run-out table.
- Operators regularly request speed reduction.
- Products collide at the exit.
- Surface scratches increase.
- Bundles are uneven.
- The line stops while stacks are moved.
- Quality staff cannot inspect parts before the next product arrives.
Automatic Receiving and Stacking
Automatic equipment may perform:
- Product counting
- Unloading
- Turning
- Layer formation
- Alignment
- Stacking
- Bundle transfer
Jinbolida’s Forming Machine Auxiliary Equipment can be evaluated when receiving and handling restrict production.
Automation should match product length, weight and profile stability. A stacker that works well for rigid C-channels may require different support for thin U-channels.
8. Minor Stops Are Not Recorded
Factories often record major breakdowns but ignore short interruptions.
Minor stops may include:
- Sensor contamination
- Slug jams
- Feed alarms
- Material tracking corrections
- Profile removal
- Product counting
- Manual measurements
- Label changes
- Guide adjustments
- Scrap removal
A two-minute stop may not seem important. If it occurs twenty times per shift, it becomes forty minutes of lost production.
Use Reason Codes
The control system or operator record should classify stops by cause.
Useful reason codes include:
- Material
- Feeding
- Punching
- Forming
- Cutting
- Stacking
- Inspection
- Tooling
- Safety
- Operator
- Utilities
- Unknown
Avoid using one broad category such as “machine stop,” because it does not identify the corrective action.
Review Frequency and Duration
A long but rare failure requires a different solution from a short stop that occurs every few minutes.
Track both:
- Total time lost
- Number of occurrences
High-frequency minor stops often reveal unstable sensors, poor scrap removal or repetitive handling delays.
9. Maintenance Access Extends Downtime
A production line may be designed to fit the smallest possible space, but inadequate maintenance clearance makes repairs slower.
Technicians need access to:
- Decoiler mandrel
- Leveling rollers
- Servo feeder
- Punching dies
- Forming shafts
- Drive system
- Bearings
- Straightening unit
- Cutting tools
- Electrical cabinet
- Hydraulic station
- Scrap chutes
If major components cannot be removed safely, maintenance takes longer and creates additional risk.
The Solar Support Bracket Forming Machine Line Layout Guide explains how material flow, utilities, stacking and service areas should be incorporated into the factory layout.
10. Production Targets Use Unrealistic Assumptions
Capacity estimates often assume:
- Maximum forming speed
- No coil changes
- No profile changes
- No inspection
- No maintenance
- No rejection
- Perfect material
- Immediate stacking
- Continuous operator availability
These assumptions do not describe normal production.
Practical Capacity Formula
A simple shift estimate can begin with:
Qualified output = theoretical output × availability × performance rate × quality rate
Each factor should be based on recorded production rather than an arbitrary assumption.
For example:
- Theoretical output: 1,200 pieces per shift
- Availability: 85%
- Performance rate: 90%
- Quality rate: 97%
The estimated qualified output is approximately 890 pieces per shift.
This example is not a universal benchmark. It demonstrates why theoretical capacity and qualified output can differ substantially.
Use Product-Specific Capacity
The same line may have different capacity for:
- Long profiles with few holes
- Short profiles with frequent cuts
- Thick high-strength material
- Dense slot patterns
- Products requiring manual inspection
- Profiles requiring frequent changeover
A capacity matrix is more useful than one headline speed.
Measuring Production Loss
Factories should collect enough information to identify the largest improvement opportunity.
| Metric | What it shows | Recommended unit |
|---|---|---|
| Qualified output | Accepted production | Pieces per shift |
| Mechanical speed | Roller-section movement | Meters per minute |
| Actual average speed | Complete operating performance | Meters per minute |
| Availability | Time available for production | Percentage |
| Changeover time | Lost time between products | Minutes |
| Coil-change time | Material replacement efficiency | Minutes |
| Setup scrap | Material lost during adjustment | Meters or kilograms |
| Rejection rate | Quality loss | Percentage |
| Punching cycle | Hole-processing constraint | Seconds per product |
| Cutting cycle | Length-separation constraint | Seconds per cut |
| Minor stops | Repeated interruptions | Count and minutes |
| Stacking delay | Exit-handling constraint | Minutes per shift |
NIST’s Sustainable Manufacturing Indicator Repository reflects the broader importance of measurable manufacturing indicators. A photovoltaic bracket factory should select metrics that lead to specific production and resource-efficiency actions.
How to Find the Real Bottleneck
Step 1: Select One Representative Product
Record the profile drawing, material, length, hole pattern and required quality.
Step 2: Time Every Repeated Operation
Measure:
- Feeding
- Punching
- Forming
- Cutting
- Product removal
- Stacking
Step 3: Record All Stops
Include both major downtime and minor interruptions.
Step 4: Separate Good and Rejected Production
Do not count rework or rejected parts as qualified output.
Step 5: Identify the Constraint
Look for:
- The slowest repeated cycle
- The most frequent stop
- The largest total downtime
- The main defect source
- The longest changeover task
Step 6: Improve One Constraint
Increasing speed in several areas simultaneously can make results difficult to interpret. Improve the confirmed bottleneck first and then measure the complete line again.
Improvement Priorities by Symptom
| Production symptom | Likely priority |
|---|---|
| Line pauses at every hole pattern | Punching and feeding cycle |
| Roll former waits for the cutter | Cutting method or synchronization |
| Long stop at end of every coil | Coil handling or strip joining |
| Excessive trial material after changeover | Setup standardization |
| Profiles collect at the exit | Receiving and stacking |
| Output is high but rejection increases | Quality and process stability |
| Frequent short alarms | Sensor, scrap or feeding analysis |
| Maintenance takes too long | Access and spare-parts planning |
| Different shifts produce different results | Training and recipe control |
| Capacity changes greatly by product | Product-specific planning |
Automation Does Not Automatically Remove Bottlenecks
Automation is useful when it addresses a measurable restriction.
Examples include:
- Double-head decoiler for frequent coil changes
- Servo feeding for variable hole patterns
- Flying cutting for short repeated products
- Automatic stacking for long high-volume profiles
- Recipe management for frequent changeovers
- Alarm history for repeated minor stops
- Tool-life monitoring for punching maintenance
However, adding automation to an unstable process can increase complexity without improving qualified output.
Before adding equipment, confirm:
- Current bottleneck
- Expected time reduction
- Product range
- Interface requirements
- Maintenance capability
- Operator training
- Acceptance method
Factory Acceptance Testing for Output
A factory acceptance test should verify both quality and capacity.
The test should use:
- Agreed material
- Representative profile
- Real hole pattern
- Required product length
- Normal line settings
- Agreed inspection method
Record:
- Continuous running time
- Total pieces
- Qualified pieces
- Rejected pieces
- Minor stops
- Alarm causes
- Punching cycle
- Cutting cycle
- Average speed
- Tooling condition
- Stacking performance
Testing only the roll former without the required punching and cutting cycles does not demonstrate full-line capacity.
For more information about complete coil processing, refer to Steel Coil Processing Machines for PV Brackets.
Information Needed for a Capacity Review
A machine supplier or engineering team needs:
- Profile drawings
- Material grade
- Material thickness
- Coil weight
- Product lengths
- Hole patterns
- Batch quantities
- Number of shifts
- Changeover frequency
- Current cycle times
- Downtime records
- Rejection records
- Existing layout
- Stacking method
- Target output
Without this information, capacity improvement recommendations remain general.
Conclusion
Photovoltaic bracket roll forming lines lose output when the complete production cycle is slower or less stable than the advertised forming speed.
Punching, cutting, coil replacement, changeovers, defects, minor stops and stacking frequently reduce qualified production. The most effective improvement begins by measuring every repeated operation and identifying the true bottleneck.
Factories should track qualified pieces per shift, availability, changeover time, setup scrap, rejection rate and stop reasons. Improving the slowest or least stable process creates more value than increasing the speed of equipment that already waits for another operation.
Jinbolida provides photovoltaic bracket forming machines, punching equipment and auxiliary automation for complete production-line solutions. Manufacturers can submit product drawings, cycle data, factory layouts and output targets through the Jinbolida contact page for a line-specific capacity evaluation.
FAQ
Why is actual roll forming output lower than the rated speed?
Rated speed often describes only the roller section. Actual output also includes punching, cutting, coil replacement, changeovers, inspection, downtime and stacking. Material strength and hole density also change performance. Qualified finished pieces per shift provide a more realistic measure than maximum meters per minute.
What is the most common bottleneck in photovoltaic bracket roll forming?
There is no single bottleneck for every line. Dense hole patterns often make punching the constraint, while short products may be limited by cutting. Long profiles may be restricted by manual stacking. A time study using the real profile, material and hole pattern is required to identify the slowest repeated operation.
How should a factory calculate qualified production capacity?
Start with theoretical pieces based on product length and line speed, then account for availability, actual operating performance and quality rate. Include coil changes, setup, inspection, minor stops and rejected products. Capacity should be calculated separately for representative products because their punching and cutting cycles differ.
Can automatic stacking significantly improve line output?
Automatic stacking can improve output when operators cannot remove and align profiles as quickly as the line produces them. It is especially valuable for long, heavy or high-volume products. Before adding a stacker, measure how often receiving causes slowdowns and confirm that the proposed system supports every profile geometry.
How can changeover time be reduced without changing the machine?
Prepare tooling, material, drawings, recipes and inspection instruments before stopping the line. Record proven settings for every product, identify tool locations and standardize the changeover sequence. Measure from the last qualified old product to the first qualified new product so setup and first-article approval are both included.
 English
  Arabic
  Russian
  Spanish
  French