
How to Calculate Solar Bracket Production Line Capacity
Table of Contents
Introduction
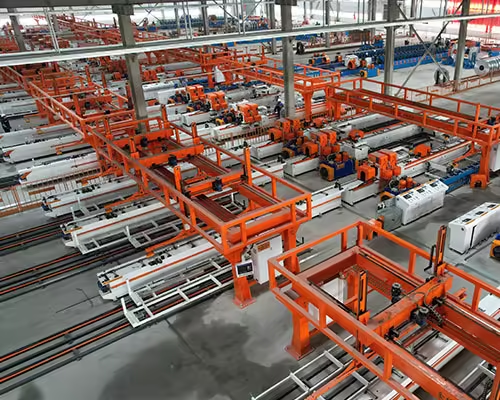
Production capacity is one of the first specifications discussed when planning a solar bracket production line, but it is also one of the easiest specifications to misunderstand. A machine may be described by a maximum roll forming speed in meters per minute, yet that number alone does not tell a factory how many qualified C-channels, U-channels, solar rails, support profiles, or connector components it can actually produce during a shift.
Real output depends on the complete manufacturing cycle. Feeding, punching, roll forming, cutting, unloading, coil replacement, profile changeover, inspection, material handling, maintenance, and unplanned interruptions all influence the number of finished parts leaving the line.
This difference becomes especially important in photovoltaic bracket manufacturing because many profiles contain repeated holes, elongated slots, connection features, or different cutting lengths. The roll former may be capable of moving material faster than the punching or cutting system can process the required pattern.
For a factory evaluating new photovoltaic bracket manufacturing equipment, capacity should therefore be calculated from the finished product backward. The important question is not simply “How fast can the roll forming machine run?” but “How many qualified brackets can this complete production line reliably deliver per shift?”
Key Takeaways
- Maximum roll forming speed is not the same as finished production capacity.
- Product length, hole quantity, punching cycle and cutting method can become the real bottleneck.
- Pieces per hour and tons per shift are often more useful than meters per minute.
- Changeovers, coil replacement, inspection and downtime should be included in realistic capacity calculations.
- Different C-channel, U-channel and solar rail profiles can produce very different output on the same machine.
- RFQ capacity requirements should be based on actual product drawings and monthly demand rather than a headline machine speed.
Why Solar Bracket Production Line Capacity Cannot Be Judged by Line Speed Alone
Roll forming equipment is commonly described using a linear speed such as meters per minute. This is useful because it indicates how quickly material can pass through the forming section under specified conditions. However, a complete solar bracket production line includes several operations before and after forming.
A typical line may include a decoiler, feeding or leveling system, punching equipment, roll forming stations, straightening, cutting, discharge and control systems. More automated configurations may also incorporate stacking, transfer systems or additional inspection and handling functions.
The production line can only operate as fast as its slowest required operation.
If the roll former is mechanically capable of running continuously but the punching unit must stop the material several times for every finished bracket, punching determines the practical cycle. If punching is continuous but the cutting method requires a longer stop, cutting may become the restriction. If both operations are fast but operators frequently stop production to change coils or adjust tooling, effective shift output falls again.
This is why Jinbolida’s guide to solar support bracket forming machine line layout treats forming, punching, utilities, floor space and output as parts of one production system rather than independent specifications.
Start With the Finished Solar Bracket
The most reliable capacity calculation begins with the component that must leave the production line.
Before calculating output, define the product length, cross-section, material thickness, coil width, number of holes, hole spacing, number of punched faces, cutting requirement and expected batch quantity. If the factory produces several profiles, each major product family should be calculated separately.
Consider two components manufactured on the same forming line. The first is a relatively long C-channel with only a few holes in the web. The second is a shorter mounting profile containing repeated slots and holes on several surfaces. Even when both pass through the roll forming section at the same nominal speed, their finished pieces-per-hour output may be significantly different.
Product length also changes the relationship between linear speed and piece count. A line producing long profiles naturally completes fewer individual pieces per minute than the same line producing shorter parts.
This leads to an important principle:
Capacity specifications should describe finished products, not only machine movement.
The Basic Solar Bracket Production Capacity Formula
For a profile produced continuously without a slower punching or cutting cycle, a simplified theoretical calculation is:
Production capacity in pieces per minute = effective line speed ÷ finished product length
Hourly theoretical output can then be estimated as:
Pieces per hour = line speed ÷ product length × 60
For example, consider a hypothetical production line running at an effective 20 meters per minute while producing brackets 2.5 meters long.
The theoretical calculation would be:
20 ÷ 2.5 = 8 pieces per minute
8 × 60 = 480 pieces per hour
This does not mean the factory should automatically expect 480 qualified pieces every hour. It represents a theoretical forming-based capacity before punching cycles, cutting time, downtime, coil changes and other production losses are considered.
That distinction between theoretical and practical output is central to accurate solar bracket production line planning.
Theoretical Capacity vs Practical Capacity
A useful capacity estimate should normally distinguish between three levels of output.
| Capacity Level | What It Represents | Typical Use |
|---|---|---|
| Mechanical or maximum speed | Maximum capability of an individual machine section under suitable conditions | Basic equipment comparison |
| Theoretical line capacity | Output calculated from product length, line speed and required process cycle | Engineering planning |
| Practical production capacity | Qualified output after normal production interruptions and efficiency losses | Factory scheduling and ROI analysis |
The first number is mainly a machine specification. The second is a process calculation. The third is usually the number that matters most to the factory.
For example, if the theoretical calculation gives 480 pieces per hour and the production system achieves an assumed 85% effective operating factor during the evaluated period, practical output would be approximately 408 pieces per hour.
The 85% figure here is only an illustrative assumption, not a universal industry benchmark. Every factory should replace it with its own realistic operating data or commissioning target.
The broader lesson is more important than the example: do not multiply maximum line speed by total shift time and call the result production capacity.
Punching Can Become the Main Capacity Bottleneck
Photovoltaic mounting structures commonly contain mounting holes, slots and connection features. The U.S. Department of Energy identifies racking and tracking structures as manufactured products within the solar value chain, alongside modules and other system components. Solar manufacturing therefore extends beyond the PV module itself to the structural hardware required for complete installations.
For bracket production, the number and position of punched features can strongly influence machine output.
Suppose one bracket requires only two punching strokes while another product of similar length requires eight separate punching positions. The second product can consume much more punching time even though the roll forming section and profile length are almost identical.
Punching capacity depends on several factors:
- number of required holes or slots;
- whether multiple holes can be punched in one stroke;
- whether punching occurs on one or several surfaces;
- distance between punching positions;
- feeding acceleration and positioning;
- pre-punching or post-punching arrangement;
- whether material must stop during each punching cycle;
- press and tooling configuration.
This is why a buyer should never ask only for the maximum speed of a solar photovoltaic bracket forming machine. The supplier needs the actual hole drawing to determine whether the punching section will allow that speed to be maintained.
For lines with particularly complex hole patterns, dedicated solar photovoltaic rack punching equipment may also need to be evaluated separately from the roll forming section.
Calculate Punching Cycle Capacity Before Confirming Line Speed
When punching requires the line to stop, production can be estimated from the total process cycle rather than linear forming speed alone.
A simplified approach is:
Cycle time per finished bracket = feeding time + punching time + forming-related time + cutting time + handling time
Then:
Pieces per hour = 3,600 ÷ cycle time in seconds
This calculation becomes useful when repeated stop-start operations dominate the production process.
For example, if a particular product requires an average complete process interval of 7.5 seconds per piece, the theoretical cycle-based output would be approximately 480 pieces per hour before efficiency adjustments.
The important point is not the example number. It is the method.
Factories should calculate the cycle from the most demanding product they expect to manufacture, not only from the easiest reference profile shown during a machine demonstration.
Hole Density Matters More Than Many Buyers Expect
Two brackets with the same length can require completely different production times.
A 3-meter profile with several widely spaced holes may allow the material to move through the line with relatively few interruptions. Another 3-meter profile containing dense slots, repeated connection holes and several punching surfaces may require significantly more processing.
Hole density therefore provides a useful way to evaluate expected production complexity.
During RFQ preparation, the buyer should supply drawings for:
- the simplest profile;
- the most frequently manufactured profile;
- the most complicated punching pattern;
- the thickest material;
- the shortest and longest finished lengths.
This gives the machine supplier a much more realistic basis for calculating capacity across the planned product mix.
Using only one simple sample can produce an output estimate that looks attractive during quotation but does not represent normal factory production.
Cutting Method Also Influences Real Output
Cutting is sometimes treated as a secondary operation, but it can materially affect production capacity.
A stop-to-cut arrangement requires material movement to pause before the finished profile is cut. Depending on the overall control strategy, this interruption can reduce average production speed.
A synchronized or flying cutting approach may allow more continuous production, but it introduces additional control and mechanical requirements. Whether that added complexity is justified depends on the required line speed, product type, cutting quality and production volume.
Cutting difficulty also changes with the profile itself. An open U-channel and a more complex lipped C-profile do not necessarily place the same demands on the cutting tool.
The correct capacity calculation should therefore include actual cutting behavior, not simply assume that the forming machine will operate continuously at its nominal linear speed.
Product Length Changes Pieces-per-Hour Output
Meters per minute and pieces per hour measure two different things.
If a line processes material at the same effective linear rate, shorter finished brackets result in more individual cutting cycles and more pieces per hour. Longer profiles result in fewer pieces but may involve fewer cuts over the same total processed length.
This matters when comparing production targets.
A specification such as “500 pieces per shift” has little meaning unless the product length is defined. Likewise, “20 meters per minute” does not tell the buyer how many finished components will be produced when several lengths are scheduled on the same line.
A better RFQ should provide expected output by representative product, such as:
| Product | Finished Length | Hole Complexity | Required Output |
| Profile A | According to drawing | Low | Pieces/shift |
| Profile B | According to drawing | Medium | Pieces/shift |
| Profile C | According to drawing | High | Pieces/shift |
| Profile D | According to drawing | High | Tons/month |
The buyer can fill these fields using actual production requirements instead of asking the supplier for a single generic machine-speed number.
Coil Change Time Must Be Included
A coil-fed production line cannot operate indefinitely without material replacement.
When one coil is completed, production may stop while the next coil is loaded, positioned and prepared. The amount of lost time depends on the decoiler arrangement, material-handling equipment, coil preparation, operator organization and automation level.
If coil changes occur frequently, they can noticeably affect shift output.
The effect becomes easier to understand when calculated over a full day. A few minutes of production loss may appear insignificant when discussing one coil, but repeated across several material changes and multiple shifts, the cumulative effect becomes meaningful.
For this reason, plants planning high-volume solar bracket production should evaluate not only the roll former but also coil handling and material preparation around the line.
An efficient machine surrounded by inefficient material handling cannot deliver its theoretical production capacity.
Profile Changeover Can Reduce Capacity in Multi-Profile Production
Many photovoltaic bracket factories do not manufacture one profile continuously.
They may need to switch between C-channel, U-channel, different rail dimensions, different thicknesses or several customer-specific hole patterns. Each change can require adjustments to rollers, guides, punching tools, feeding programs, cutting tools or PLC recipes.
This introduces another form of capacity loss: changeover time.
Suppose one factory produces a single profile for long batches. A dedicated production line may spend very little time on changeovers. Another factory serving multiple project specifications may change products several times during the same shift.
Even if the second factory owns the same basic roll forming equipment, its daily output can be lower because more time is spent preparing the line rather than producing qualified parts.
Capacity planning should therefore include the expected product mix.
A machine selected for multi-profile manufacturing should be evaluated according to how repeatably and efficiently it changes between products, not only how fast it runs once correctly adjusted.
How to Calculate Effective Shift Capacity
A more realistic shift calculation can be built in several steps.
First calculate theoretical production time:
Scheduled shift time = total available minutes in the shift
Then subtract planned non-producing periods such as:
- material loading;
- coil replacement;
- profile changeover;
- scheduled inspection;
- routine cleaning;
- planned maintenance;
- operator breaks where the line cannot continue automatically.
After that, consider normal unplanned losses such as minor stops, adjustment, scrap checks or production interruptions.
Effective running time can then be multiplied by the verified production rate for the specific profile.
A simplified model is:
Practical shift output = theoretical production rate × effective operating time
For mixed-product production, calculate each profile separately rather than applying one average speed to the entire shift.
This approach is particularly useful because it can be compared against actual production data after commissioning. The factory can identify whether capacity losses originate from punching, tool changeover, material preparation, machine adjustment or another part of the process.
Calculate Tons per Shift When Material Volume Matters
Pieces per hour is useful for production scheduling, but some photovoltaic bracket factories also plan capacity in tons per shift or tons per month.
To estimate weight-based output, manufacturers first need the weight per meter of the finished profile.
A simplified calculation is:
Profile weight per piece = weight per meter × finished length
Then:
Hourly weight output = profile weight per piece × pieces per hour
Monthly capacity can subsequently be estimated from operating hours, shifts and scheduled production days.
Weight-based capacity is especially useful when production planning is tied to coil consumption, steel purchasing or project tonnage.
However, tons per month should still not be calculated from machine speed alone. Different profile geometries, material thicknesses and punching requirements can change the actual processed output even when nominal linear speed remains similar.
Do Not Use One Capacity Number for C-Channel and U-Channel Production
A solar bracket production line may be designed to manufacture several related profiles, but that does not mean each product has identical output.
Cross-section complexity affects the roll forming process. Hole patterns affect punching. Length affects cutting frequency. Material thickness and mechanical properties affect machine load and forming behavior.
Consequently, a factory planning both C-channel and U-channel products should build a separate capacity model for each major profile.
The same applies when comparing:
- fixed-tilt support profiles;
- rooftop mounting rails;
- ground-mounted structures;
- tracker-related profiles;
- connection components;
- custom project-specific brackets.
This product-based method provides a much better basis for production planning than assuming that one machine speed applies equally to every photovoltaic support component.
How Automation Changes Capacity
Automation can improve effective output without necessarily increasing the maximum mechanical speed of the roll former.
For example, automated feeding can improve repetitive positioning. Program-controlled punching can reduce manual measurement and setup. Integrated cutting can shorten handling between operations. Automated unloading can reduce dependence on manual removal of finished profiles.
The important benefit is often not a dramatic increase in headline meters per minute. It is the reduction of interruptions between production steps.
This distinction matters when evaluating equipment.
A machine running slightly slower but maintaining stable coordinated production may deliver more qualified parts during a complete shift than a machine with a higher maximum speed that frequently requires manual intervention.
For this reason, automation should be evaluated according to its effect on effective production time, repeatability and labor dependence rather than treated only as an additional machine feature.
Connector Components Require a Different Capacity Calculation
Not every solar mounting component is a long roll-formed profile.
Short connecting components may be punched, cut and formed using a different process. Their output is better expressed in seconds per piece rather than meters per minute.
For example, Jinbolida’s solar photovoltaic bracket connector punching machine is designed around automatic punching, cutting and forming of photovoltaic connection components. This illustrates why different solar bracket products require different capacity metrics: long continuous profiles and short stamped connectors should not be evaluated using the same output formula.
When a factory plans a complete photovoltaic bracket manufacturing system, each equipment family should therefore have a suitable capacity unit.
Long profiles may be evaluated in meters, pieces and tons. Connector equipment may be evaluated primarily in pieces per minute or cycle time per piece.
The complete factory capacity is then determined by whether these equipment groups can support the required production ratio between structural profiles and connection components.
Find the Bottleneck Before Increasing Machine Speed
If a factory needs more output, increasing forming speed is not always the correct first solution.
The first step should be to identify which operation is limiting actual production.
If punching is the bottleneck, a faster forming section may provide little benefit. The better solution may involve punching several features in one stroke, improving feeding control or changing the punching arrangement.
If cutting is limiting production, the cutting method may deserve attention.
If changeovers consume a large proportion of available time, faster and more repeatable tooling adjustment may generate a larger productivity improvement than increasing line speed.
If coil replacement creates frequent stops, material-handling improvements may deliver better results.
Capacity improvement should therefore follow bottleneck analysis rather than a simple “faster machine” approach.
Build Capacity Around Required Monthly Demand
Machine selection becomes more practical when monthly production demand is converted into required shift output.
Suppose a factory has a target number of tons or pieces per month. The planning process should work backward through:
- production days per month;
- shifts per day;
- scheduled hours per shift;
- expected effective operating ratio;
- planned product mix;
- output of each major profile.
This produces a minimum required practical production rate.
The required machine capacity should then include a reasonable operating margin, but the margin should be based on production planning rather than an arbitrary preference for the highest available speed.
Oversizing a line can introduce unnecessary investment and complexity, while undersizing it can create scheduling pressure and limit future project capacity.
The correct objective is balanced capacity.
Capacity Should Be Verified During Factory Acceptance Testing
A machine quotation may contain estimated production speed, but the buyer should also define how capacity will be verified before shipment.
Factory acceptance testing should use an agreed product drawing and, where practical, representative material.
Instead of testing only whether the machine can briefly reach a specified speed, the test should evaluate a meaningful production run.
The finished products should be checked for:
- profile dimensions;
- hole locations;
- cutting length;
- straightness;
- visible surface condition;
- consistency between consecutive parts.
This prevents a situation where high speed is achieved only by sacrificing product stability.
The capacity that matters is qualified production capacity.
A line producing more meters but creating excessive adjustment, scrap or rework is not necessarily the more productive line.
What Capacity Information Should Be Included in an RFQ?
A useful RFQ should allow the equipment supplier to calculate rather than guess.
Instead of writing only “high-speed solar bracket machine required,” provide the production information in a structured form.
| RFQ Information | What to Provide | Why It Matters |
| Profile drawings | Cross-sections and dimensions | Determines forming complexity |
| Finished lengths | Minimum, maximum and common lengths | Determines pieces-per-hour calculation |
| Material | Grade, thickness and coating | Influences forming and punching requirements |
| Hole pattern | Hole type, number, spacing and surfaces | Helps calculate punching cycle |
| Product mix | Percentage of each major profile | Supports realistic average capacity |
| Batch size | Typical quantity per production run | Determines changeover impact |
| Shift plan | Hours and shifts per day | Supports daily capacity calculation |
| Monthly target | Pieces or tons per month | Defines required practical output |
| Changeover frequency | Expected profile changes per shift/day | Identifies lost production time |
| Automation target | Manual, semi-automatic or integrated | Influences handling and effective runtime |
Providing these details makes it possible to compare different production-line proposals on the basis of real manufacturing requirements.
A Better Way to Compare Two Solar Bracket Production Lines
When comparing equipment quotations, do not place maximum speed at the top of the decision table and ignore everything else.
Ask both suppliers to calculate capacity for the same representative product drawing.
For example, provide the same:
- C-channel profile;
- steel grade and thickness;
- finished length;
- hole pattern;
- required cutting method;
- production batch;
- shift duration.
Then ask each supplier to state:
- forming speed;
- punching cycle;
- cutting cycle;
- expected qualified pieces per hour;
- expected output per shift;
- required operators;
- profile changeover method;
- estimated changeover time;
- assumptions used in the calculation.
This produces a much more meaningful comparison than simply placing “20 m/min” and “30 m/min” side by side.
The production line with the higher nominal speed is not automatically the line with the higher practical output.
Practical Capacity Planning Checklist
Before finalizing a solar bracket production line, the factory should be able to answer several basic questions.
What profiles will account for most of the monthly volume? How many holes does each profile require? Which product creates the longest punching cycle? How often will profiles change? How many coil changes are expected during a normal shift? Is production measured primarily in pieces, meters or tons? What output is required during peak project demand? Which process is likely to become the bottleneck?
These questions convert capacity planning from a sales specification into an engineering exercise.
They also make future production improvement easier because the factory has a clear baseline for identifying whether lost output originates in forming, punching, cutting, changeover, maintenance or material handling.
Conclusion
Calculating solar bracket production line capacity requires more than reading the maximum speed on a machine specification sheet.
A reliable calculation begins with the finished photovoltaic bracket and considers product length, profile geometry, material, hole pattern, punching cycle, cutting method, product mix, coil changes, changeovers and effective operating time.
Linear forming speed is still important, but it represents only one part of the production system.
For continuous profiles, theoretical pieces-per-hour output can be estimated from line speed and product length. When punching or cutting creates a slower cycle, capacity should instead be calculated from the actual complete process interval. Practical shift output should then account for normal production losses.
The most useful specification is therefore not the highest possible meters per minute. It is the number of qualified brackets the complete line can repeatedly manufacture under realistic factory conditions.
When planning a new solar bracket production line, providing detailed drawings, hole patterns, material information, product mix and monthly output targets allows the production system to be configured around actual manufacturing requirements rather than a generic speed figure.
FAQ
How do you calculate solar bracket production line capacity?
For a continuously produced profile, start by dividing effective line speed by finished product length to estimate pieces per minute, then multiply by operating time. After that, account for punching, cutting, coil replacement, changeovers, inspection and normal downtime to estimate practical production capacity.
Is a 30 m/min solar bracket machine always more productive than a 20 m/min machine?
No. The faster forming section may still be restricted by punching, cutting, feeding, unloading or changeover time. Capacity should be compared using the same finished profile, hole pattern and production conditions. Qualified pieces per hour or tons per shift usually provide a more useful comparison than maximum forming speed alone.
Does punching reduce solar bracket roll forming capacity?
It can. The effect depends on the number of holes, punching positions, tooling arrangement and whether material must stop during punching. Dense or multi-surface hole patterns can become the limiting production cycle even when the roll forming section itself is capable of operating faster.
Should solar bracket production capacity be measured in pieces or tons?
Both can be useful. Pieces per hour or per shift is practical for production scheduling, while tons per shift or month is useful for material planning and project-volume calculations. Factories producing several profile sizes should often monitor both because product length and weight can vary significantly.
What information should I send a machine supplier to calculate real output?
Provide finished profile drawings, product lengths, material grade and thickness, hole and slot patterns, expected product mix, batch quantities, monthly demand, shift schedule and required automation level. Capacity calculated from these details is more useful than a generic maximum-speed specification.
 English
  Arabic
  Russian
  Spanish
  French